Visualize Your Strategic Roadmap With Power BI
Create visibility to shape the strategy.
Organizations are struggling with too much demand for projects and not enough people to work on them. Exacerbating this situation, projects today are often requested and received without cost and benefits data. That means projects get approved but languish in a growing backlog of initiatives waiting to get off the ground. Use our two-step methodology and suite of practical tools to develop a strategic, visualized roadmap for your project portfolio, even if you don’t have enough details for a conventional PPM dashboard.
Executive leaders want to intervene and break up the string of projects stuck in a holding pattern. But how can they decide between so many competing projects with so little actionable information? Learn how to develop a strategic roadmap from the data available to you and deliver a decision-informing experience with the lowest possible friction.
1. Storytelling is a potent PPM tool.
Don’t have the kind of data typically used to prioritize projects in an ever-expanding portfolio queue? Then craft a compelling story around the information and data points you do have. IT leaders need to take a storytelling approach to unquantified funding requests.
2. Executive decision-making has atrophied over decades.
Executive leadership has become further removed from project-oriented decisions due to several shifting trends since the 1990s, including an agile product management paradigm that moved decision-making further down the org chart.
3. It’s time to reassert control of the project pipeline.
Faced with economic uncertainty and board-level pressure, executive leaders realize they must regain control of the way projects are prioritized and how resources get allocated to them. Restoring the rigor and visibility of project portfolios at the executive level is critical.
Use this step-by-step methodology to make sense of competing priorities in your project portfolio.
Our comprehensive framework helps speed up the development, presentation, and implementation of your strategic roadmap. Use our research and supporting tools to:
- Establish minimum standards for the definition of a funding request without concern for how it’s packaged (e.g. project, program, product, work effort, initiative).
- Re-establish the responsibility-authority paradigm for your portfolio across the organizational hierarchy.
- Maintain a frequently refreshed strategic roadmap that offers a transparent view of the competition for funding and resourcing.
Visualize Your Strategic Roadmap
Create visibility to shape the strategy.
Analyst perspective
Deliver the roadmap with the data you have.
We're speeding up and making IT more responsive to ever-changing business needs.
A lot of our clients sacrificed specificity and forecasting for agility, choosing to move ahead with initiatives before they were sufficiently planned. We lowered the bar on what it takes to start a project, making it more difficult to keep the resourcing needed to complete a project and creating the fertile conditions for growing technical debt.
But now, leadership needs to make sense of the competing priorities without reliable projections of cost, benefit, risk, and timing. They need to prioritize within a portfolio where they can barely distinguish between the projects.
We produced the templates in this publication to speed up the presentation of your strategic roadmap and deliver a decision-informing experience with the lowest possible friction.
Use these materials to restart the decision-making conversation.

Barry Cousins
Distinguished Analyst and Research Fellow
Info-Tech Research Group
Executive summary
Your Challenge
- New project demand hasn't slowed after the disruption of COVID-19 and AI.
- You reorganized and reoriented around the product management or enterprise architecture paradigms.
- Project definition, sizing, and forecasting has devolved to the point where there is urgent demand for barely defined projects.
- Executive leadership wants to intervene, but they are not equipped with actionable information.
Common Obstacles
- The supply-demand imbalance (between project demand and resource supply) is obvious and debilitating but unmeasurable because estimates and forecasts are no longer required.
- You lack the software systems and methodologies needed to simplify and accelerate your roadmap production.
- Board-level pressure and economic uncertainty are intensifying leadership's resolve to reassert control of project prioritization and resource utilization.
Info-Tech's Approach
- Establish minimum standards for the definition of a funding request without concern for how it's packaged (project, program, product, work effort, initiative, etc.).
- Re-establish the responsibility-authority paradigm for your portfolio across the organizational hierarchy.
- Maintain a frequently refreshed strategic roadmap that offers a transparent view of the competition for funding and resourcing.
Info-Tech Insight
Decision-making has been impeded by a lack of actionable, quantified forecasts of costs and benefits. Develop your roadmap around the data that is available, and avoid extending your standards beyond the organization's current capability.
These templates can help to overcome decades of decision-making atrophy
If you don't have the cost/benefit/risk data needed to prioritize, use these templates for a storytelling approach to resolving unquantified funding requests.
Corporations have increasingly distanced the individual from business consequences:
- The contemporaneous shift to "empowerment" and "matrix management" in the 1990s rendered workers unmanageable and the number of unsuccessful work assignments exploded.
- Widespread adoption of a "consensus model" rendered executives unaccountable for results and the number of approved but unsuccessful projects exploded.
- The shift to an Agile or product management paradigm moved decision-making down the organizational chart and away from executive accountability, leaving leadership uninformed and powerless.
- Corporate social responsibility (CSR) initiatives drove spending and activities unrelated to the corporate mission as a form of brand-centric virtue signaling.
- The focus on near-term earnings distanced executives from the consequences of an ineffective long-term strategy.
- The cessation of resource management practices disabled IT's ability to understand their own capacity for project work and made it impossible to quantify availability.
Executive leadership is now expected to claw back their decision-making capability and authority, but it's been eroding for decades.
Use this research to reestablish the dialogue between strategic authority and project delivery.
Use these resources to redevelop your ability to manage (i.e. to control spending and resources).
Should you use this model?
It's a citizen developer solution, and it's not for everyone.
Data skills
- These templates are for people who manage their project portfolio data in Excel or SharePoint lists. There is no software application preventing you from entering illogical or incompatible data.
- On the other hand, it's quite a bit faster to manage data this way if you can bear the burden of data quality.
Power BI skills
- These templates offer a rich reporting solution when compared to Excel charting. They are based on a relational data model that is constructed from your Excel or SharePoint list data.
- You don't have to be a Power BI developer to use these templates, but we recommend having a developer available if you choose to extend or modify the solution.
Platform management
- The reports are accessed via Power BI Service, a cloud-based reporting platform. Rather than emailing your spreadsheet data around the executive tier, you will be managing file versions, data refreshes, and uptime in development, test, staging, and production environments. It's far more powerful than Excel, but you will be managing a service rather than periodically distributing emails.
As-is, and the customizations are yours
- We've been collaborating with our membership on these solutions for over a decade through our Advisory Services, helping each other succeed. These templates are openly published for your use, as-is. However, it's not a software product. There's no warranty or technical support.
Info-Tech offers various levels of support to best suit your needs
| DIY Toolkit | Guided Implementation | Workshop | Executive & Technical Counseling | Consulting |
|---|---|---|---|---|
| "Our team has already made this critical project a priority, and we have the time and capability, but some guidance along the way would be helpful." | "Our team knows that we need to fix a process, but we need assistance to determine where to focus. Some check-ins along the way would help keep us on track." | "We need to hit the ground running and get this project kicked off immediately. Our team has the ability to take this over once we get a framework and strategy in place." | "Our team and processes are maturing; however, to expedite the journey we'll need a seasoned practitioner to coach and validate approaches, deliverables, and opportunities." | "Our team does not have the time or the knowledge to take this project on. We need assistance through the entirety of this project." |
Diagnostics and consistent frameworks are used throughout all five options.
1 Establish minimum request standards
1-3 hours
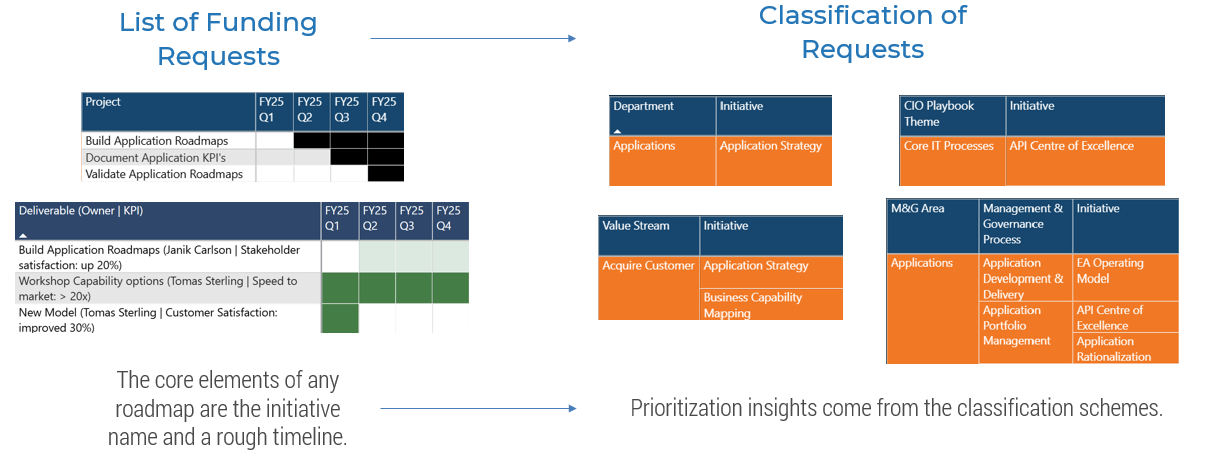
The following slides describe the two key components of our strategic roadmap:
- The list of projects with a high-level start and end date.
- The different classification options:
- Initiatives within Department
- CIO Playbook Theme
- Initiatives within Value Stream
- Management & Governance Theme/Process
It's fine to use multiple views, though it's best to select a primary lens for your roadmap by combining the project list with your preferred classification option.
| Input | Output |
|---|---|
|
|
| Materials | Participants |
|
|
Establish minimum request standards
Strategic roadmaps need to enforce minimum expectations to make the roadmap options comparable. They should include project name, start and end dates, and classification.
Strategic roadmap options
Roadmap visualizations can range from high-level abstractions to more detailed progress updates.
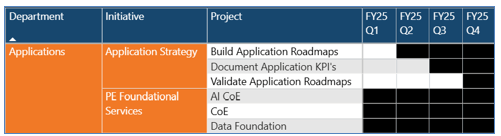
Basic Strategic Roadmap
Classification by Department and Initiative (Program), Timelines by Quarter
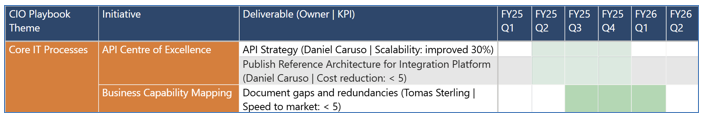
CIO Playbook Roadmap
Classification by CIO Playbook Theme and Initiative (Program), Timelines by Quarter, Progress
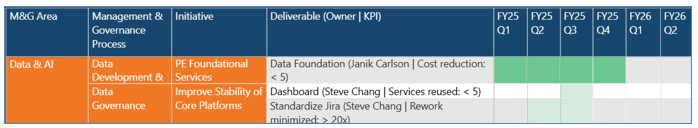
M&G Roadmap
Classification by Management & Governance categories and Initiative (Program), Timelines by Quarter, Progress
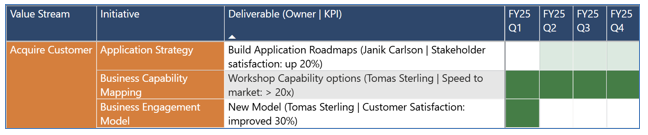
EA Roadmap
Classification by Enterprise Architecture Value Stream and Initiative (Program), Timelines by Quarter, Progress
2 Publish and maintain your roadmap
5-10 hours
The following slides describe the solution architecture (how the files fit together) and the process for installing the templates at your location. A template is provided to document your file and workspace names for different environments.
These are the skills requirements:
- Excel (Intermediate)
- Maintain a set of tables in Excel.
- Preserve the table integrity as if the table is a genuine database table (proper spelling, no duplicate values, relationships between tables preserved).
- Maintain the data as the projects and classifications evolve.
- Power BI Desktop
- Provide https:// location of your Excel file in the Power BI parameters.
- Refresh data and publish to Power BI Service.
- Power BI Service
- Maintain credentials and implement refresh schedule.
| Input | Output |
|---|---|
|
|
| Materials | Participants |
|
|

About Info-Tech
Info-Tech Research Group is the world’s fastest-growing information technology research and advisory company, proudly serving over 30,000 IT professionals.
We produce unbiased and highly relevant research to help CIOs and IT leaders make strategic, timely, and well-informed decisions. We partner closely with IT teams to provide everything they need, from actionable tools to analyst guidance, ensuring they deliver measurable results for their organizations.
What Is a Blueprint?
A blueprint is designed to be a roadmap, containing a methodology and the tools and templates you need to solve your IT problems.
Each blueprint can be accompanied by a Guided Implementation that provides you access to our world-class analysts to help you get through the project.
Talk to an Analyst
Our analyst calls are focused on helping our members use the research we produce, and our experts will guide you to successful project completion.
Book an Analyst Call on This Topic
You can start as early as tomorrow morning. Our analysts will explain the process during your first call.
Get Advice From a Subject Matter Expert
Each call will focus on explaining the material and helping you to plan your project, interpret and analyze the results of each project step, and set the direction for your next project step.
Unlock Sample ResearchContributors
- Prashant Kulkarni, IT Manager, Brother International Corporation
- 6 anonymous contributors
 Develop a Project Portfolio Management Strategy
 Measure IT Project Value
 Maintain an Organized Portfolio
 Optimize IT Project Intake, Approval, and Prioritization
 Refine Your Estimation Practices With Top-Down Allocations
 Establish Realistic IT Resource Management Practices
 Grow Your Own PPM Solution
 Prepare to Successfully Deploy PPM Software
 Tame the Project Backlog
 Select and Implement an IT PPM Solution
 Audit the Project Portfolio
 Get Started With IT Project Portfolio Management
 Bring Visibility to Your Day-to-Day Projects
 Drive Business Value With a Right-Sized Project Gating Process
 Demystify the New PMBOK Guide and PMI Certifications
 Make Sense of Strategic Portfolio Management
 Maximize the Value of IT Across Enterprise Portfolios
 Deliver Engaging Portfolio Reports With Power BI
 Run IT By the Numbers
 Transform IT, Transform Everything
 Assessing the AI Ecosystem
 Sync or Sink: Aligning IT and HR for the Future of Work
 Building the Road to Governing Digital Intelligence
 Bring AI Out of the Shadows
 The AI Vendor Landscape in IT
 IT Spend and Staffing Benchmarking
 An Operational Framework for Rolling Out AI
 Visualize Your Strategic Roadmap With Power BI