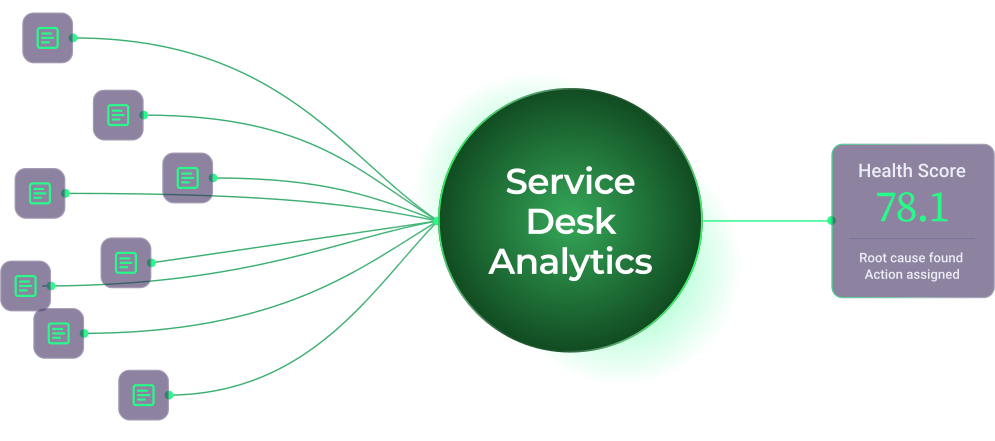
Service Desk Analytics
Powered by:
 CIO Analytics
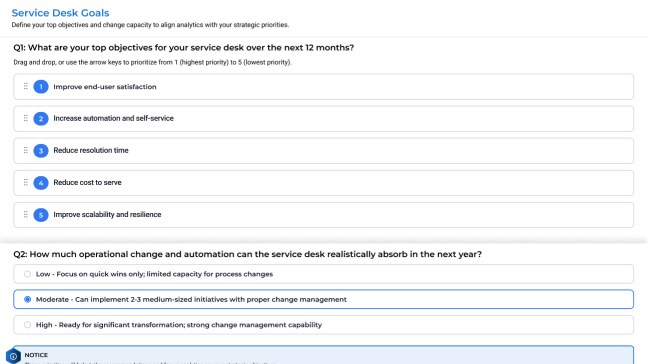
Your ITSM platform tells you what happened. It does not tell you what it means.
Service Desk Analytics turns your service desk data into a continuous improvement engine. It surfaces patterns, prioritizes actions, and connects your team to the guidance they need to fix root causes, not just close tickets.
I'm InterestedIncluded with your Infotech membership.
IT Service Desks Generate Thousands of Tickets a Month.
...Almost No One Looks for the Patterns.
Zero cost or effort, we've already built it, your team just connects
Auto-categorizes thousands of tickets, no manual work
Advisory-grade insights without digging through data yourself
Monthly leadership briefing built around stories, not just numbers
See exactly which departments, apps, and locations drive your ticket volume
Root cause of repetitive tickets, found before they escalate
Highest-impact shift-left opportunities, deflection potential included
Measurable service desk improvements every month, with trackable actions
CIO Analytics:
Eight Steps. One Platform. Zero Guesswork.
From first connection to final recommendation, CIO Analytics turns your service desk data into a living, always-current picture — with the research, benchmarks, and next steps built in.
Data Collection
Foundation & Configuration
- Low effort, high impact, zero incremental cost (included in your membership).
- One click to get started. Complete access in hours, not days.
- Continuous data-driven Service Desk improvements, without extra CIO effort.
Executive Summary
C-Suite Health Dashboard
- CIO-level summary of your service desk with out-of-the-box metrics.
- Top 3-5 prioritized recommendations analyzed and ready monthly.
- Assign and track improvement tasks directly from the summary.
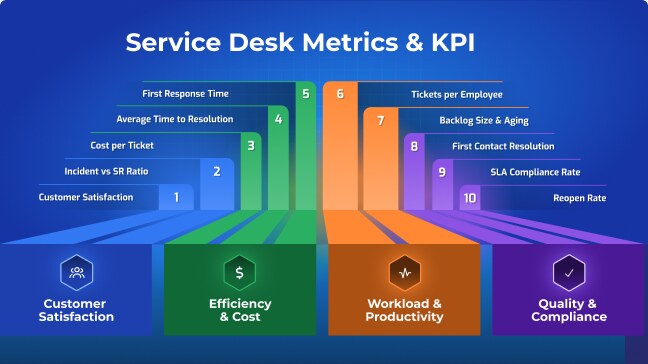
Metrics & KPI
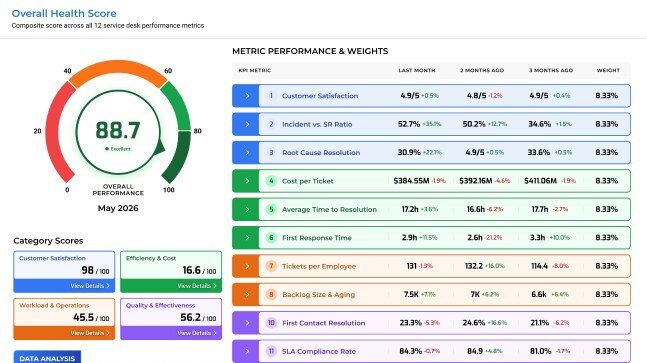
12-Metric Performance Framework
- The 12 service desk KPIs that matter the most, scored automatically.
- A consistent, monthly view of how your service desk actually performs.
- Automated reports with deep insights and historical performance for key metric categories.
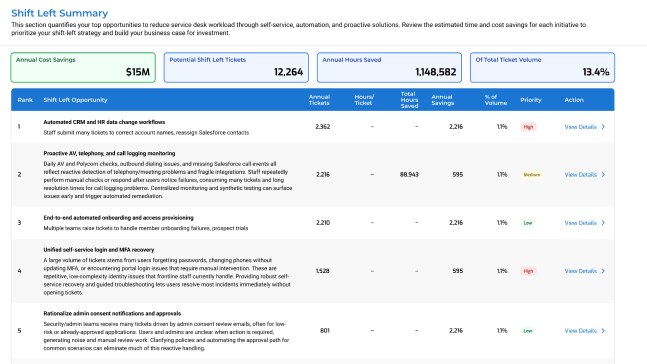
Optimization
Repetitive Tickets & Shift-Left Opportunities
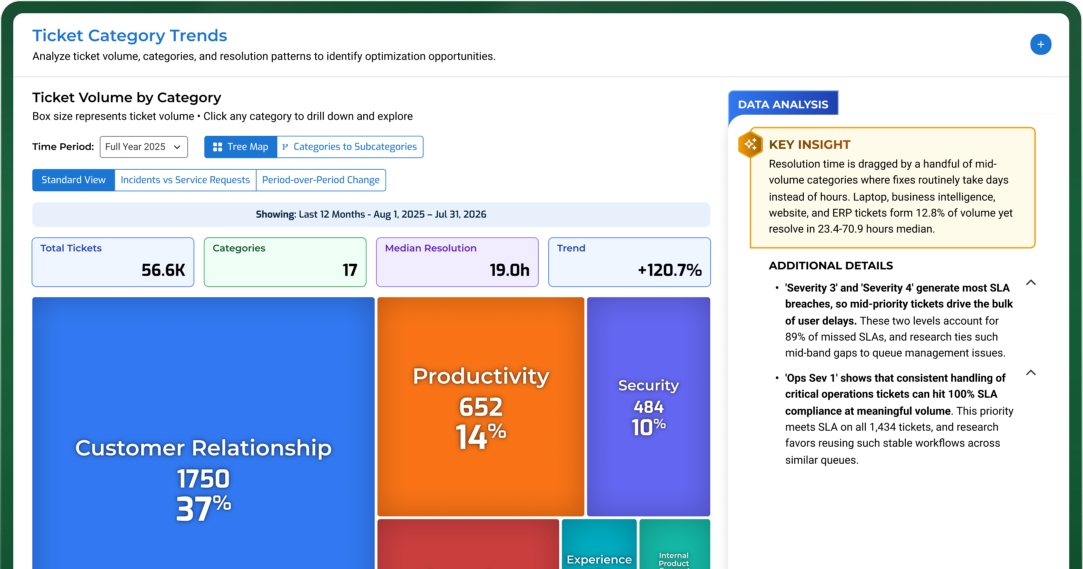
- Uncover the ticket categories, departments, applications, and locations driving the most volume, and why.
- Identify your most repetitive ticket patterns and the root causes behind them.
- Quantify your shift-left opportunities and assign clear actions to deflect tickets.
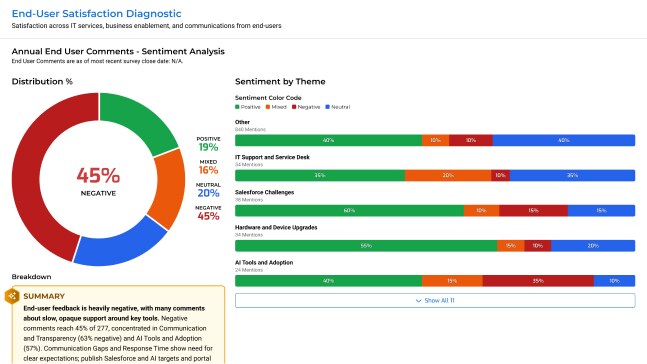
End-User Satisfaction
Multi-Source Satisfaction Analysis
- Analyze ticket-level satisfaction scores to understand the patterns driving positive and negative service desk experiences.
- Correlate your broader end-user satisfaction survey results with ticket patterns across departments so you know what's actually driving satisfaction.
- CIOs who don't proactively measure and manage satisfaction are flying blind. Leverage the data to get ahead of it before it becomes a business problem.
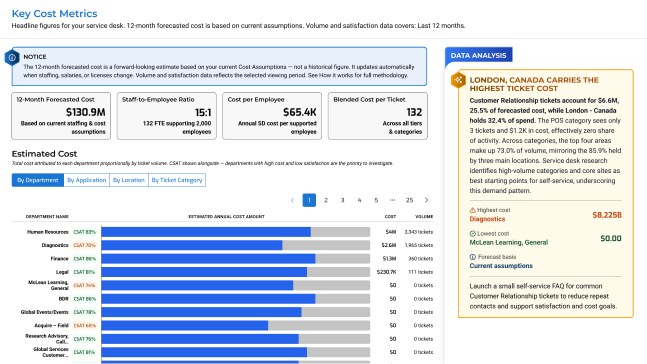
Cost Effectiveness & Benchmarking
Key Cost Metrics, Structure & Optimization
- Understand your full cost structure: what you spend, where you spend it, and how it breaks down across tiers, departments, and categories.
- See how your cost compares to satisfaction so you know which investments are delivering value and which aren't.
- Identify cost reduction opportunities and model the savings.
Structure, Staffing, & Process
Operating Model Health Overview
- Expose routing failures, intake gaps, and ticket leakage.
- Separate structural issues and gaps from individual performance so you fix the right thing.
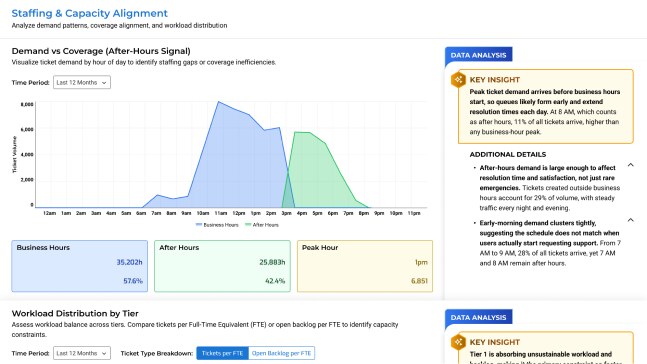
- Map staffing capacity against real-time demand to help right-size coverage.
AI-Assisted Advisory
Request Tailored Updates
- Start with Infotech’s research, frameworks, and analyst expertise so your deliverable is grounded in proven insight, not generic AI output.
- Let AI draft the deliverable, tailored to your organization, in a fraction of the time it would take to build from scratch.
- Have an Infotech analyst review and refine the draft so you walk away with a board-ready output you can confidently put your name to.
Included with your Infotech membership.
Three capabilities that native ITSM reporting and generic BI tools cannot replicate.
Analyst-grade intelligence for IT operations
The platform applies Infotech's established, analyst-grade research methodology to your ticket data. Every insight is grounded in how the best IT organizations actually operate, not just what your own numbers say in isolation.
Benchmarked against organizations like yours
Performance is contextualized against anonymized peer organizations so you see whether a metric reflects a structural problem or a competitive gap, and then you get the specificity you need to act on it.
From insight to assigned action
Findings do not sit in a slide deck. The platform generates prioritized, trackable initiatives with impact scoring, effort estimates, and implementation timelines. Every diagnostic tab feeds a unified action plan your team owns.
Spend less time gathering information and more time improving IT performance.
The best IT leaders will not manage their service desk by instinct
Service Desk Analytics gives you the methodology, the benchmarks, and the action plan, built on 25 years of IT research and the data from your own operation.