Transform Table Operations With SmartPit Technology
Effortless play, seamless management, and ultimate efficiency
- Manual operations in table games lead to errors and inefficiencies in various areas such as fills, credits, player management, and loyalty programs.
- Casinos lose millions yearly due to dealer errors in tracking players and chips, resulting in inaccurate ratings and misallocated comps.
- Table games often lack cashless capabilities, creating a siloed patron experience compared to slots and electronic gaming machines.
- The industry struggles with labor shortages, where finding and retaining experienced dealers is difficult.
Our Advice
Critical Insight
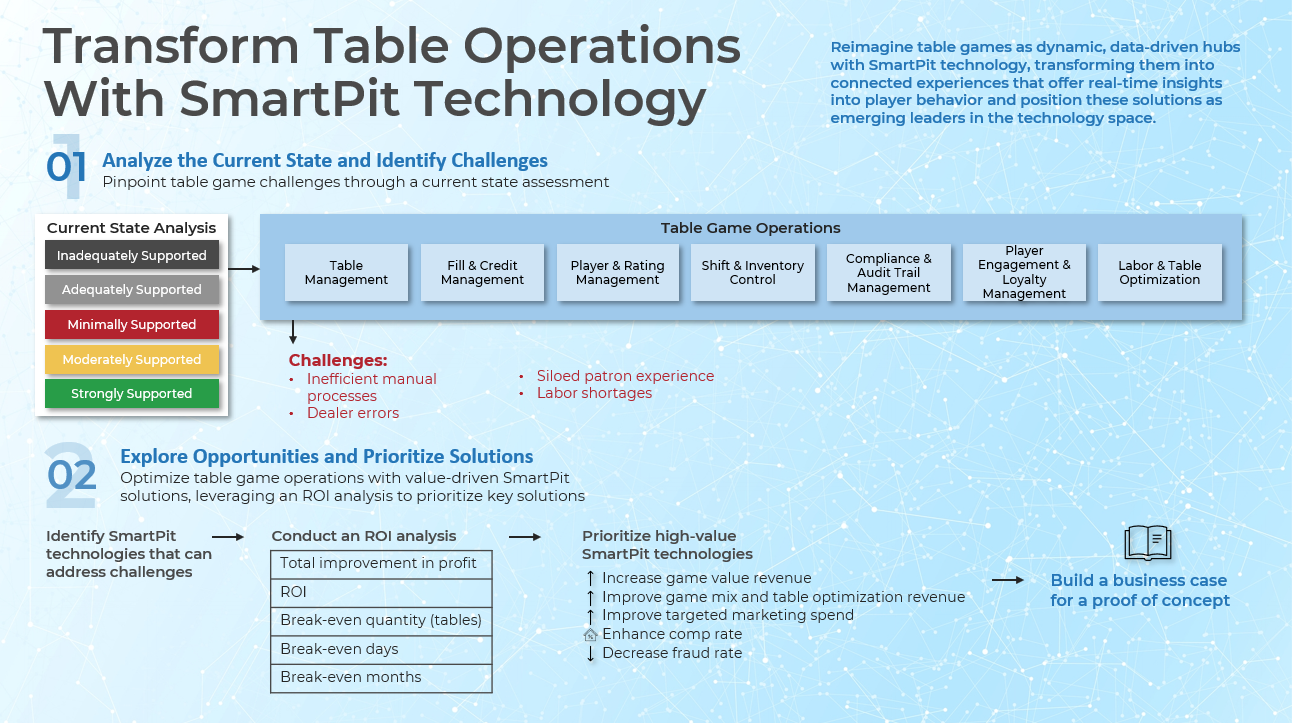
Reimagine table games as dynamic, data-driven hubs with SmartPit technology, transforming them into connected experiences that offer real-time insights into player behavior and position these solutions as emerging leaders in the technology space.
Impact and Result
- Analyze the current state of table game operations using detailed analysis to identify challenges and areas for improvement, documenting pains and gains.
- Explore the recommended SmartPit opportunities, discover process changes, and prioritize solutions providing the most value and return on investment.
- Leverage the ROI analysis to build a business case for a proof of concept and buy-in.
Member Testimonials
After each Info-Tech experience, we ask our members to quantify the real-time savings, monetary impact, and project improvements our research helped them achieve. See our top member experiences for this blueprint and what our clients have to say.
9.0/10
Overall Impact
Client
Experience
Impact
$ Saved
Days Saved
Mohegan Gaming and Entertainment
Guided Implementation
9/10
N/A
N/A
Elizabeth was wonderful as usual. There was a lot of knowledge internally on the topic so there wasn't much that we didn't know (which is a good t... Read More
Transform Table Operations With SmartPit Technology
Effortless play, seamless management, and ultimate efficiency.
Analyst perspective
Redefine the industry with SmartPit

Imagine a casino where table games are not just a source of entertainment but a sophisticated, data-driven ecosystem that enhances both player experience and operational efficiency.
By integrating SmartPit technology, casinos can transform these traditional games into dynamic hubs that provide real-time insights into player behavior, optimize staffing, and streamline processes.
This shift not only addresses the immediate challenges of manual operations and labor shortages but also positions table games as a key driver of innovation in the digital age.
Embracing this technology could redefine the industry, making table games the emerging leader in modernizing casino operations and elevating the overall gaming experience.
Elizabeth Silva Smulski
Senior Research Analyst, Gaming, Hospitality, Sports & Entertainment Industry
Info-Tech Research Group
Executive summary
Your Challenge |
Common Obstacles |
Info-Tech’s Approach |
|---|---|---|
Manual operations in table games lead to errors and inefficiencies in various areas such as fills, credits, player management, and loyalty programs. Casinos lose millions annually due to dealer errors in tracking players and chips, resulting in inaccurate ratings and misallocated comps. Table games often lack cashless capabilities, creating a siloed patron experience compared to slots and electronic gaming machines. The industry struggles with labor shortages, where finding and retaining experienced dealers is difficult. |
Integration with existing infrastructure can be challenging and require significant resources. The upfront cost of implementing advanced technologies can be a barrier. Ensuring the security of player data and financial transactions is crucial and can be a significant hurdle. Staff need to be trained to use new technologies effectively, which can be time-consuming and costly. Gaining regulatory approval for new technology can be challenging due to complex and evolving gaming regulations. |
Analyze the current state of table game operations using detailed analysis to identify challenges and areas for improvement, documenting pains and gains. Explore the recommended SmartPit opportunities, discover process changes, and prioritize solutions providing the most value and return on investment. Leverage the ROI analysis to build a business case for a proof of concept and buy-in. |
Info-Tech Insight
Reimagine table games as dynamic, data-driven hubs with SmartPit technology, transforming them into connected experiences that offer real-time insights into player behavior and position these solutions as emerging leaders in the technology space.
Your challenge
Top challenges associated with traditional table game operations in casinos:
Inefficient manual processes:
- Fills and credits: Manual handling of fills and credits can lead to errors and inefficiencies.
- Player and rating management: Tracking player activity and ratings manually can result in inaccuracies.
- Shift and inventory control: Managing shifts and inventory without automation is time-consuming and prone to mistakes.
- Loyalty programs: Manual tracking of loyalty points and rewards can lead to misallocations.
- Labor and table optimization: Optimizing labor and table usage manually is challenging and often inefficient.
Dealer errors:
- Inaccurate tracking: Mistakes in tracking players and chips can lead to financial losses.
- Misallocation of comps: Errors in player ratings can result in over-comping or under-comping, affecting customer satisfaction and casino profitability.
Siloed patron experience:
- Lack of cashless capabilities: Table games often lack cashless or virtual wallet options, unlike slots and electronic gaming machines (EGMs), leading to a fragmented experience for patrons.
Labor shortages:
- Difficulty finding experienced dealers: The industry faces challenges in recruiting and retaining skilled dealers, exacerbated by current labor shortages.
- Efficient staffing: Ensuring efficient staffing levels is a top challenge due to the scarcity of experienced personnel.
Cashless is Queen
18% of purchases are made in cash within the US.
Source: CDC, 2024.
Businesses that accept digital payments typically see an increase in sales of 10% - 30%.
Source: CDC, 2024.
Common obstacles
Overcoming the challenges in table game operations involves several obstacles:
Integration issues:
- Compatibility: Ensuring current software and hardware, data migration, and seamless operation are critical concerns of SmartPit technology. Addressing these issues involves thorough planning, collaboration with vendors, and potentially upgrading legacy systems to ensure smooth integration.
Initial investment:
- Upfront costs: This includes purchasing equipment, software, and infrastructure, as well as potential downtime during installation. To overcome this, casino operators can explore financing options, phased implementation strategies, and detailed cost-benefit analyses to justify the investment.
Data security concerns:
- Protecting player data: This involves protecting against cyber threats, ensuring compliance with data protection regulations, and maintaining the integrity of sensitive information. Implementing robust security measures, regular audits, and partnering with reputable technology providers can help address these concerns.
Training and adaptation:
- On-going training investment: This includes not only initial training but also ongoing support to ensure staff proficiency and confidence in using the new systems. Investing in comprehensive training programs, providing user-friendly interfaces, and fostering a culture of continuous learning can help mitigate this obstacle.
Complex gaming regulations:
- Regulatory approvals and certifications: Gaining regulatory approval for new SmartPit technology on casino floors can be challenging due to the need to comply with complex and evolving gaming regulations. Operators must ensure the technology meets stringent standards for security, fairness, and consumer protection, which can be a lengthy and resource-intensive process.
Info-Tech’s approach
This structured approach ensures a comprehensive evaluation and implementation of SmartPit technology:
- Analyze the current state and identify challenges:
- Conduct a thorough value chain analysis of table game operations using the Excel-based tool to identify challenges and areas for improvement.
- Assign a weight to each key theme to determine the importance related to table games.
- Document pains and gains associated with the current processes, identifying satisfaction per capability.
- Explore opportunities and prioritize solutions:
- Conduct a trends analysis identifying SmartPit innovations.
- Discover process changes and recommended SmartPit solutions that can address challenges.
- Discover the vendors that offer SmartPit technology solutions.
- Enter the identified opportunities into the ROI analysis tool and prioritize high-value SmartPit solutions.
- Build the case for a proof of concept:
- Leverage the analysis to build a business case for a proof of concept.
The Info-Tech difference:
- The use of an Excel-based tool for thorough analysis allows for a data-driven approach to identify inefficiencies and areas for improvement, ensuring that decisions are based on concrete data rather than intuition.
- This methodology includes an ROI analysis tool to prioritize solutions that showcase high value, ensuring a well-rounded evaluation of potential solutions.
- This approach provides a clear and justified rationale for investment, which is often lacking in traditional methods.
Leverage smart tables to secure a technological advantage
INDUSTRY: Gaming
SOURCE: Walker Digital Table Systems, 2024.
Challenge |
Solution |
Results |
|---|---|---|
The Macau gaming industry is highly competitive, with casinos striving to improve market share and operational efficiency amidst challenges like high competition, slow gameplay, operational costs, counterfeit chip usage, and the need for technological advancements to maintain a competitive edge. |
MGM China adopted smart gaming tables early, giving it a technological advantage over its competitors in Macau. The use of RFID chips and enhanced player marketing efforts has allowed MGM China to capture market share more effectively. This early adoption positions MGM to outperform its competitors throughout 2024 and possibly into 2025, as others are slower in rolling out similar technologies. |
As a result of its early investment in SmartPit technology, MGM China is expected to continue outperforming its peers, with Citibank ranking the company as its top pick in Macau. The company’s proactive strategy has helped it achieve its market share growth and a record in adjusted property EBITDAR in Q4 2023. MGM’s technological advantage is projected to maintain its dominance in the market through 2024, contributing to continued profitability and growth. |
Info-Tech’s methodology for SmartPit technology
1. Analyze the Current State and Identify Challenges |
2. Explore Opportunities and Prioritize Solutions |
Next Steps: Build the Business Case for a Proof of Concept |
|
|---|---|---|---|
Phase Steps |
|
|
|
Phase Outcomes |
Identify current challenges in table game operations and the drivers for modernization. Conduct a thorough analysis of table game operations using the Excel-based tool to identify inefficiencies and areas for improvement. |
Explore process changes and SmartPit solutions that can address the identified challenges. Leverage the ROI analysis tool to prioritize solutions that showcase high value to the business. |
Develop a business case for a proof of concept, leveraging the research in Launch Your Hospitality Innovation Initiative to Success to support the proposal. |
Insight summary
Reimagine table games with data
Reimagine table games as dynamic, data-driven hubs with SmartPit technology, transforming them into connected experiences that offer real-time insights into player behavior and position these solutions as emerging leaders in the technology space.
The SmartPit advantage
By thoroughly analyzing the current state of table game operations, casinos can uncover hidden inefficiencies, and pain points that SmartPit technology can address, paving the way for a more streamlined and profitable operation.
Unveil hidden profits
Exploring process changes and technological solutions allows casinos to identify and prioritize the most impactful opportunities, ensuring that SmartPit technology is implemented where it can deliver the most significant benefits and ROI.

About Info-Tech
Info-Tech Research Group is the world’s fastest-growing information technology research and advisory company, proudly serving over 30,000 IT professionals.
We produce unbiased and highly relevant research to help CIOs and IT leaders make strategic, timely, and well-informed decisions. We partner closely with IT teams to provide everything they need, from actionable tools to analyst guidance, ensuring they deliver measurable results for their organizations.
What Is a Blueprint?
A blueprint is designed to be a roadmap, containing a methodology and the tools and templates you need to solve your IT problems.
Each blueprint can be accompanied by a Guided Implementation that provides you access to our world-class analysts to help you get through the project.
Talk to an Analyst
Our analyst calls are focused on helping our members use the research we produce, and our experts will guide you to successful project completion.
Book an Analyst Call on This Topic
You can start as early as tomorrow morning. Our analysts will explain the process during your first call.
Get Advice From a Subject Matter Expert
Each call will focus on explaining the material and helping you to plan your project, interpret and analyze the results of each project step, and set the direction for your next project step.
Unlock Sample ResearchContributors
- Jody Campbell, SVP, Business Development, NRT Tech
- David Croft, SVP of Gaming Optimisation & Strategy, Tangam Systems
- Brian Fretz, Table Games Project & Product Development Manager
- Stephan Richer, VP & CTO, ROBCO Gaming
- Anonymous Contributor, VP of Architecture & Innovation